
On a purely molecular level, fentanyl is more potent than heroin so pharma keeps cajoling health departments to buy more expensive higher dose naloxone and new reversal drugs (like nalmefene), see details by Hill et al.
It would be really helpful to know if the average dose per reversal has changed during the fentanyl era.
Let's look at the overdose data from Allegheny County Health Department. And let's combine it with 17.5 years of data from our friends at Prevention Point Pittsburgh, a harm reduction program in Pittsburgh, Pennsylvania, USA.
We expanded the scope beyond Prevention Point's 2019 published paper which found:
Despite increases in fentanyl-contributed deaths, there were no statistically significant differences between any of the 4 years (2013–2016) on average number of naloxone doses used by participants to reverse an overdose (F = 0.88; P = .449). Conclusion: Even though IMF is more potent than heroin and is a rapidly increasing contributor to drug overdose deaths in Allegheny County, the average dose of naloxone administered has not changed.
We worked together to refresh the analysis. From July 2005 to January 2023 there were 16,904 service encounters by 7,582 unique participants, resulting in 70,234 naloxone doses dispensed, with 5,521 overdose response events (OREs), utilizing 8,756 doses of naloxone. The person who had overdosed was judged to be “okay” 98.0% of the time after receiving naloxone.
We presented these data at the Compassionate Overdose Response Summit. Watch a video of us talking through this analysis (1:22:25 timestamp), and what this program looks like IRL.
Eras of Overdose
We can define each era by the most prominent substance involved in (at least half of) overdose deaths. There was a lot of overlap from 2005 to 2015 so these labels could be quibbled with, or you can just treat 2008-15 as the Rx opioid + heroin era.
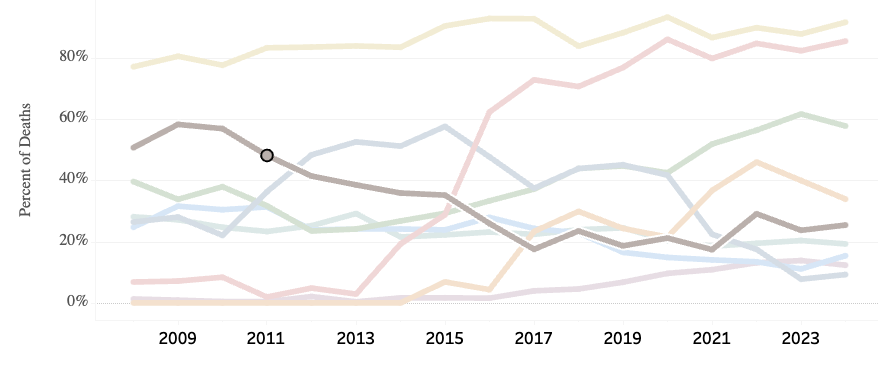
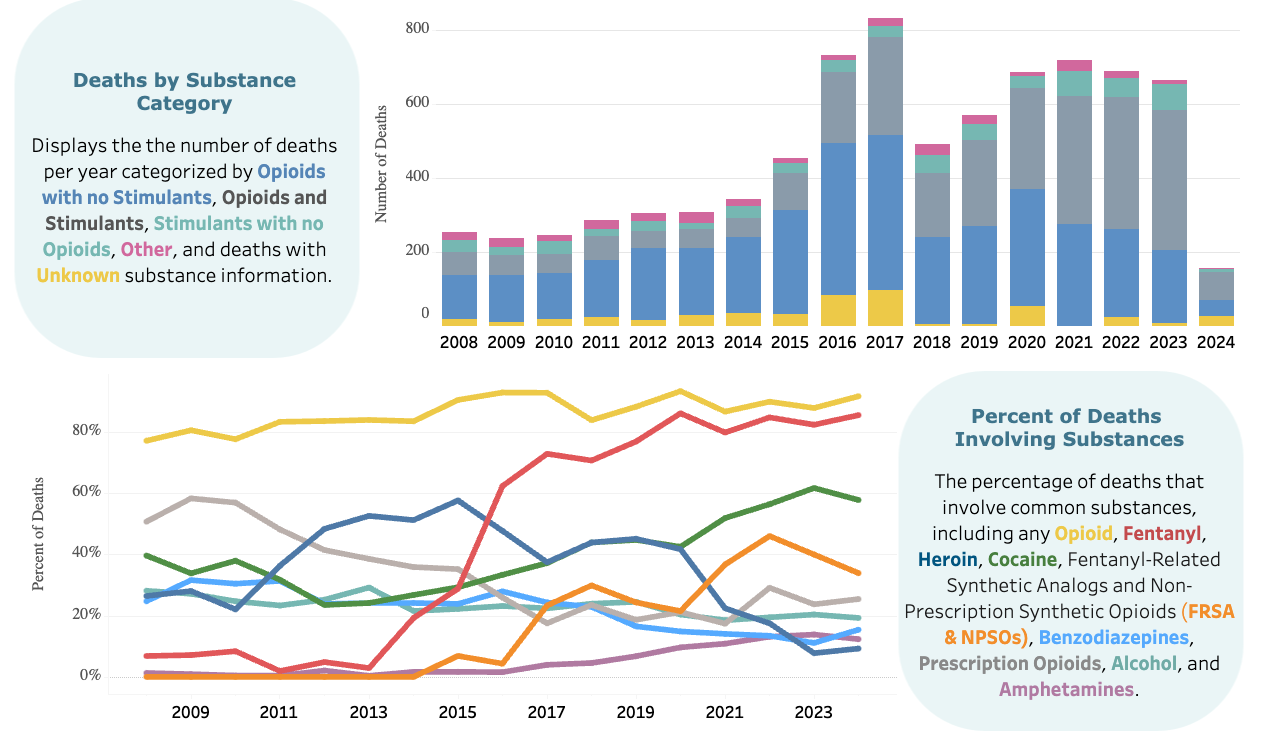
The next 3 graphs show substances involved in overdose deaths, per year, in Allegheny County (where Pittsburgh is located). The yellow line up top is any/all opioids, and the colored lines are specific types of substances.
Rx opioids Era. Let's call this 2008 to 2011. Prescription opioid were involved in 53.5% of overdose deaths during these years, after which less than half involved Rx opioids.
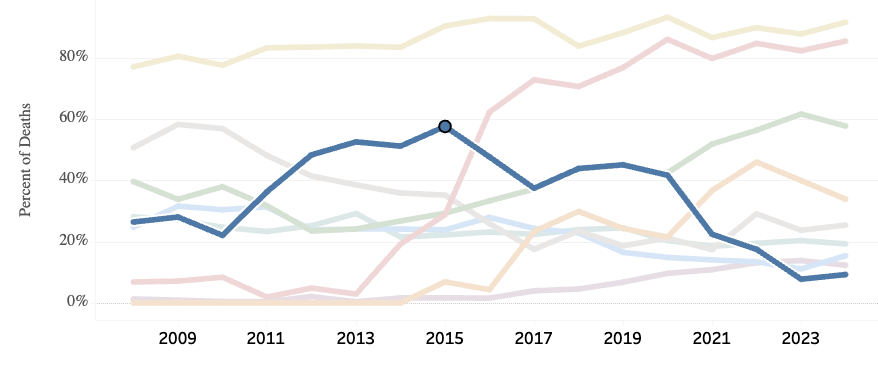
Heroin Era. About 2012 to 2015. Heroin was involved in 52.5% of overdose deaths.
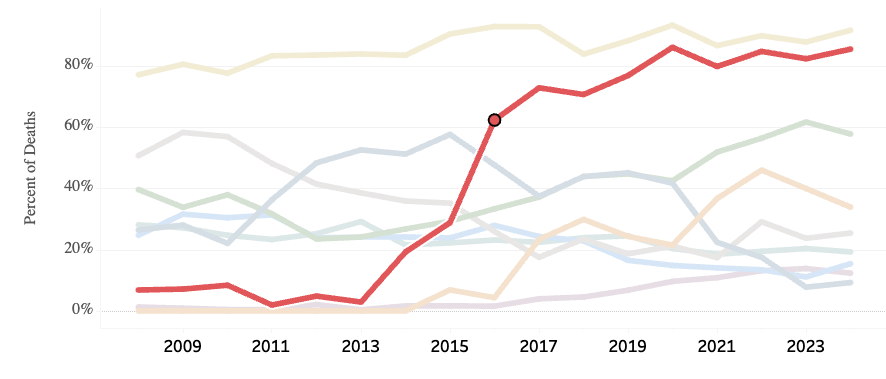
Fentanyl Era. Starting in 2016 and continuing to end of study in January 2023 (and beyond). Fentanyl was involved in 77% of overdose deaths.
Naloxone Dose
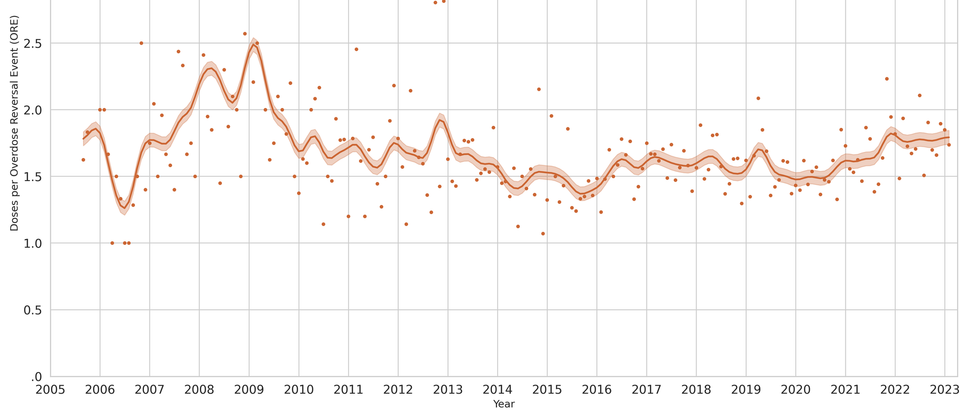
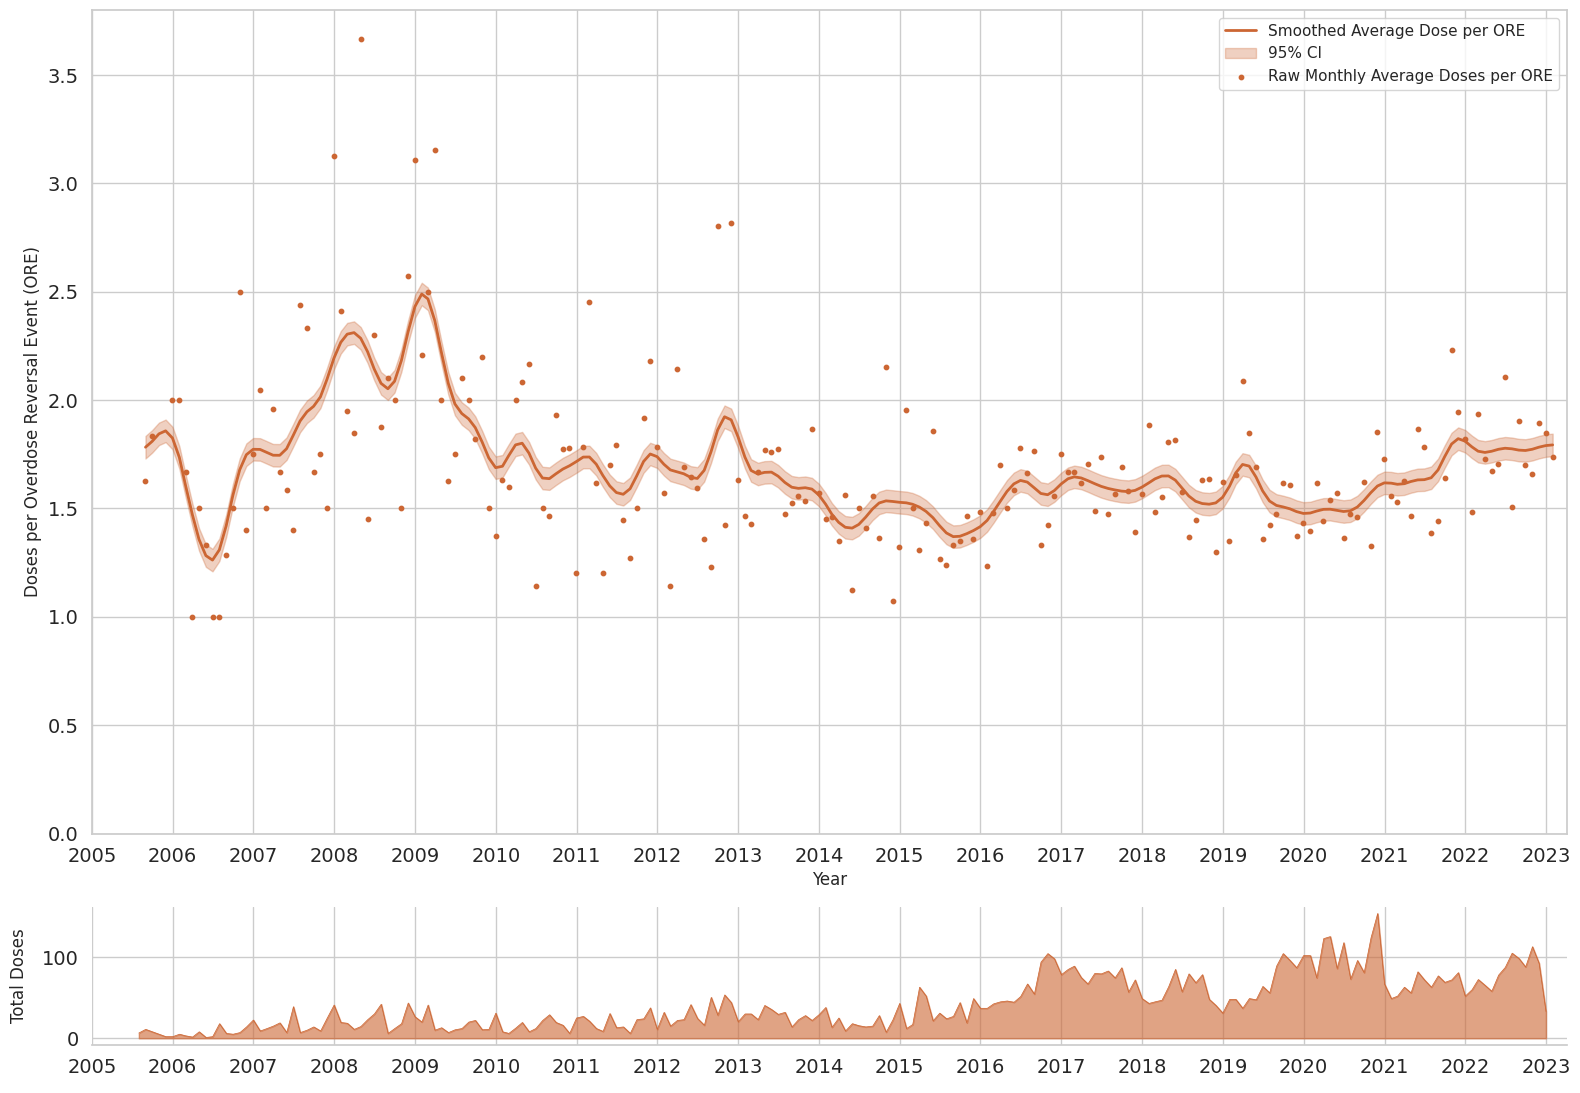
The average dose per reversal from 2005 to 2023 was 1.63, with 98.0% survival rate. To be clear, that is LESS THAN TWO DOSES of 4 mg nasal spray. It is LESS THAN TWO DOSES of 0.4 mg/mL intramuscular naloxone.
The graph below shows the monthly average number of doses per overdose response event, over 17.5 years. The short graph below is number of total doses administered by Prevention Point Pittsburgh participants.
Let's break this down into the eras above, using the arithmetic average.
| Era | Years | % OD Deaths | Naloxone per Reversal |
|---|---|---|---|
| Rx opioids | 2008-11 | 53% | 1.92 doses |
| Heroin | 2012-15 | 52% | 1.57 doses |
| Fentanyl | 2016-23 | 77% | 1.60 doses |
| Rx opioids + heroin | 2008-15 | 1.70 doses |
From 2008 to 2011, prescription opioids were involved in 53% of overdose deaths, with the balance predominantly heroin. During these years, average naloxone per ORE (overdose reversal event) was 1.92 doses (95% CI: 2.05, 1.79).
Heroin started replacing prescription opioids, becoming more dominant starting in 2012, involved in 52% of overdose deaths from 2012-15. During these years, average naloxone per ORE was 1.57 doses (95% CI: 1.64, 1.50).
Fentanyl emerged in 2016 and remained dominant into 2023, on average in 77% of annual overdose deaths. During these years, average naloxone per ORE was 1.60 doses (95% CI: 1.63, 1.57).
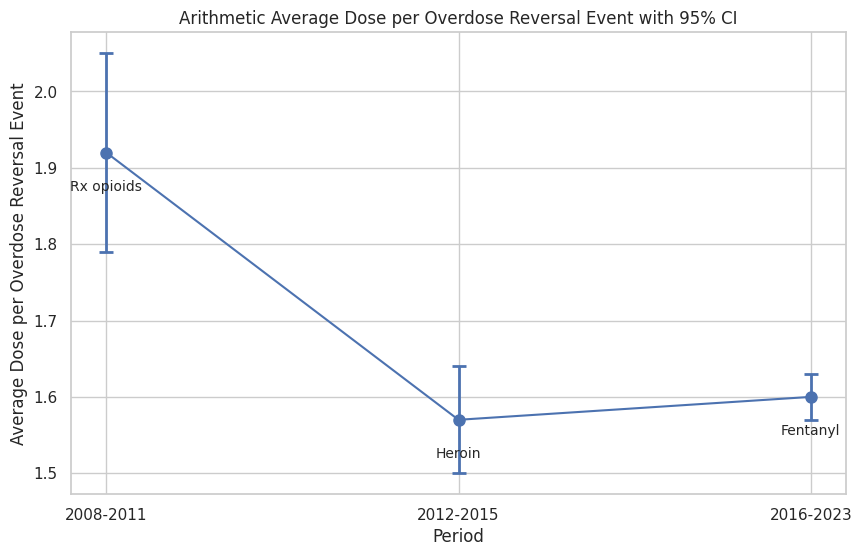
And for all y'all stats nerds, the difference between heroin and fentanyl eras is not statistically significant. You can use whatever test you'd like (overlapping confidence intervals is fine), we really cannot say that 1.57 vs. 1.60 are statistically different.
And hey, if you don't like these eras, that's fine. Take a look at the 17 timeline and cut it up however you'd like. Even in a year where fentanyl was involved in 86% of overdose deaths (2020), the average doses per reversal was 1.54.
Caveats
We caveat that during this time, people who use drugs were learning how to adapt to the influx of fentanyl, and naloxone availability was greatly increased. We don't have data on concentration of fentanyl per bag/pill. Carfentanil was also a factor during this time period.
Formulation Effect
But why would doses per reversal be highest during the Rx opioid era? It's not because of methadone, but good thought Data Detective. There's a more direct explanation, that would be obvious to anyone who packed a kit or volunteered at Prevention Point Pittsburgh.

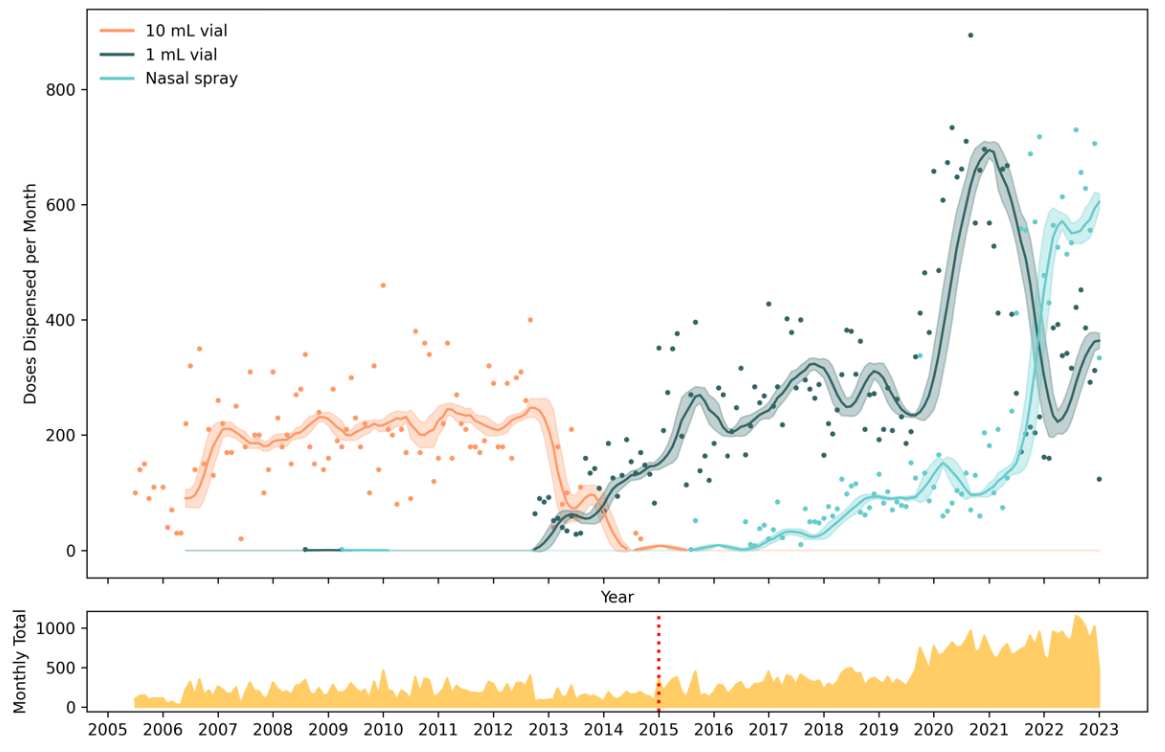
Right. So let's see which formulations were dispensed at Prevention Point Pittsburgh. The 10 mL vial was the only thing available until 2012. So the "Prescription Opioid Era" had the 10 mL multi-dose vial, which may have led people to administer more doses than needed just based on the form factor. (This is why using 2005-2012 for the combined prescription opioid + heroin era was a little confounding.)
Here's the volume of what was dispensed:
And here's the average number of doses of which naloxone was utilized in reversals, by formulation:
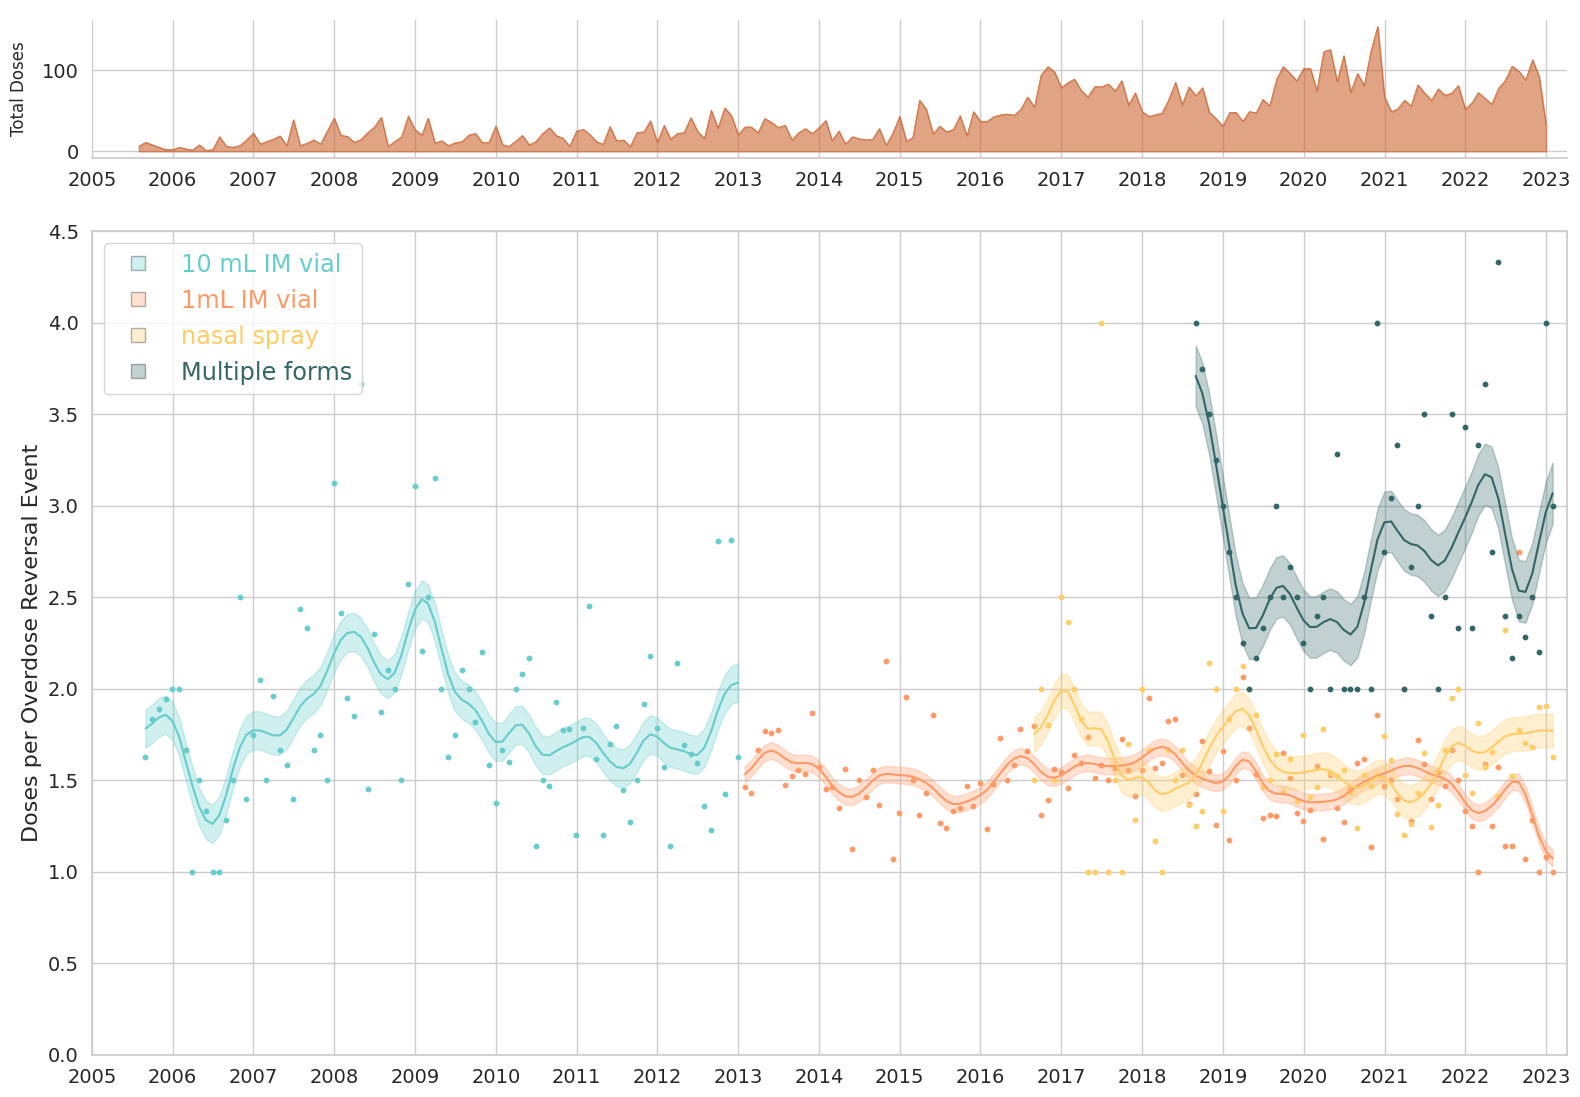
Program staff described that with the 10 mL vial it was easy for people to administer additional doses, and that unit dosing with the 1 mL vial and nasal spray reduced this behavior. In instances where many doses and/or multiple forms had been administered, program staff described that it was common for people to receive additional doses of naloxone after police or paramedics arrived, even if the person was already revived and was breathing. Therefore, extreme numbers of reported doses administered may reflect circumstances beyond the reporter’s control, and doses not dispensed by Prevention Point Pittsburgh.
Let's take this a step further and see if the number of naloxone doses differed by formulation type. Now the horizontal axis is number of doses administered per ORE. The vertical axis is standardized count frequency (called kernel density in histogram jargon).

Fig 8 from Dasgupta et al. Number of naloxone doses administered per overdose response event.
Figure legend. Average number of naloxone doses administered per overdose response event are presented with the vertical axis, smoothed using Gaussian kernel density estimators. For 1 mL and 10 mL vials, fractional dosing was observed, with less than a single full dose (1 mL of 0.4 mg/mL) being administered; this was not possible for the nasal spray, resulting in the visible left-truncation of the kernel density plot. Box plots below each graph show median and interquartile range are presented horizontally; circles represent outlier observations. Study dates: August 2005 to January 2023.
Over 17.5 years, the cumulative arithmetic average number of naloxone doses per overdose response event was 1.63 (95% CI: 1.60, 1.65), and the geometric mean was 1.44 (95% CI: 1.42, 1.46). Time trends presented in Fig 8 show two distinct patterns. The 1 mL vial and 4 mg nasal spray were used mostly as one or two doses (roughly bimodal), whereas the 10 mL vial and multiple forms represent more continuous distributions, including titrated fractional doses and administration of less than one full labeled dose to achieve reversal. When multiple forms of naloxone were administered, the number of total doses was greater (median of two versus median of one) than single formulation administrations.
The average doses per overdose response event was lowest for 1 mL vial with 1.51 doses (95% CI: 1.48, 1.54), Table 3. Using 1 mL vials as a reference group, the average number of doses per ORE was 7.5% higher (95% CI: 3.7%, 11.5% higher, χ2 = 3.9, Wald p < 0.001) for the nasal spray with 1.63 doses per ORE (95% CI: 1.58, 1.68). For the 10 mL vial, doses were 22.1% (95% CI: 15.6%, 28.9% higher doses, χ 2 = 7.1, p < 0.001) higher than the 1 mL vial with 1.85 doses per ORE (95% CI: 1.75, 1.94). When multiple forms were used, the average doses were 2.76 doses per ORE (95% CI: 2.58, 2.94).

The overall rate of naloxone doses per overdose response event in Pittsburgh remained stable over a 17.5-year period (Fig 9). Segmented regression did not yield any statistically verifiable change points (χ 2 = 0.28, 3 df, p = 0.60; Table 2) during the 17.5-year observation period of the number of doses per overdose response event (Fig S13 in S1 File).
Linear Relationship
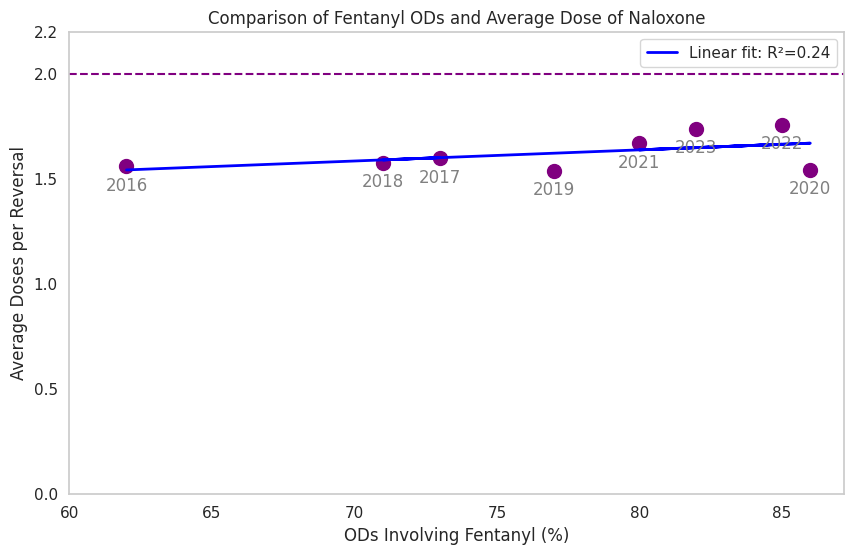
So, we wondered, does dose of naloxone go up with increasing penetration of fentanyl? Let's look at percent of OD deaths involving fentanyl during each year of the fentanyl era, plottong average dose per year. Note that ALL values are below 2.0 doses per reversal (dashed line).
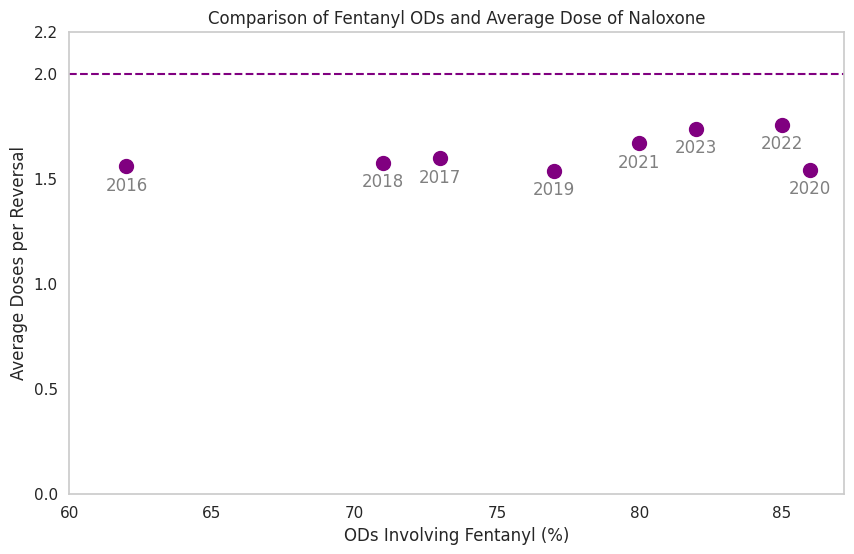
Wanna see the linear regression fit? Meh. It's nothing notable. Some little increase but still well under 2.0 doses per reversal. Interpreting the slope, for every 5% increase in fentanyl among OD deaths, we expect 0.03 higher dose to be needed on average: Nothing burger.
Conclusion
The average dose of naloxone went up 2% during the fentanyl era. In real-world situations, more fentanyl does not mean higher doses of naloxone are needed. In real-world data, cheap, generic intramuscular and lower-dose sprays work just fine.
📈 Data Notes
Definitions
Dose was defined as the lowest single dose in approved labeling for overdose reversal. For 1 mL and 10 mL vials, a single dose was defined as 0.4 mg delivered intramuscularly, and 4 mg intranasally (in one nare) for the nasal spray.
Overdose response events (ORE) include any report of an attempted overdose reversal regardless of the outcome of the event (successful resuscitation, death, or unknown outcome) where naloxone was administered. While the term “reversals” is commonly used in the literature, “ORE” was considered a more accurate term in the context of these data.
Overdose data
To see these data in full on the County government website, click here, and go to "Fatal Trends." Scroll down to the bottom.
Here are the numbers from the County Tableau site.
% Rx opioids = 53.5%
2008: 51
2009: 58
2010: 57
2011: 48
Crossover in 2012, near equal parts heroin (48%) and Rx opioids (41%)
% Heroin = 52.5%
2012: 48%
2013: 53%
2014: 51%
2015: 58%
Fentanyl emerged in 2014, increasing from 3% the previous year to 19%.
% Fentanyl = 77%
2016: 62%
2017: 73%
2018: 71%
2019: 77%
2020: 86%
2021: 80%
2022: 85%
2023: 82%
Funding
This research was funded by the US Food and Drug Administration via UNC (BAA #167, Contract 75F40122C00193). The views presented do not necessarily reflect the views of the Funder, and should not be construed as Guidance or policy.