
Many harm reduction programs collect overdose reversal data from participants, usually through a short paper or digital questionnaire when participants come back for naloxone refills.
Basic stats from these "surveys" often make their way into progress reports and academic papers. It may seem intuitive, but reversal reports can also complement official OD reporting systems. If reversal reports can be a speedy source of knowledge, they provide harm reduction programs with an opportunity to leverage their data to educate their participants, as well as open new avenues for funding.
This may seem obvious, but we didn't find other examples in the published literature. So we created a basic (and easy to calculate) monthly metric:
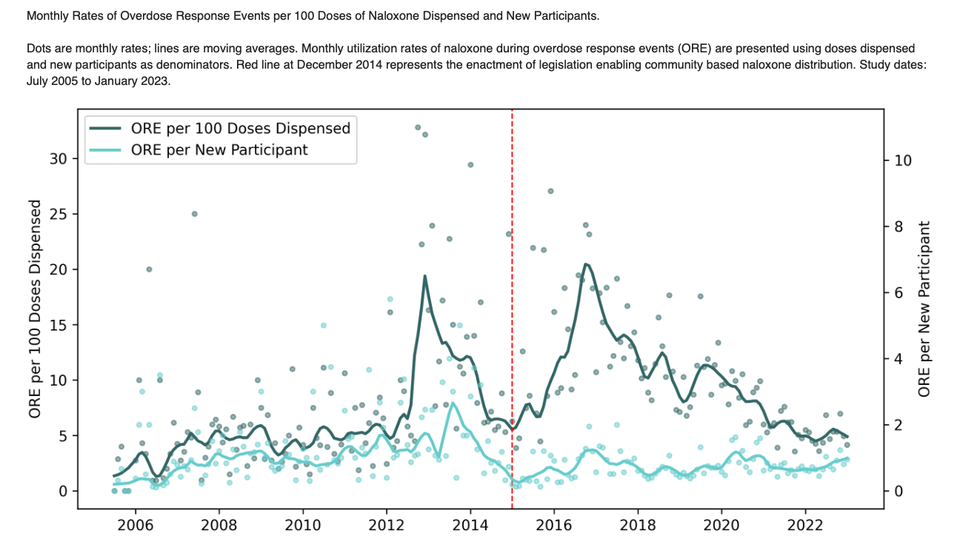
(ORE = overdose response event, often called a "reversal report")
In high volume, high utilization programs, you could approximately interpret this as the percentage of doses used within a month. This could be a helpful metric for purchasing and service planning. (Many caveats here, since average time to use can be months, naloxone can be obtained elsewhere, etc.)
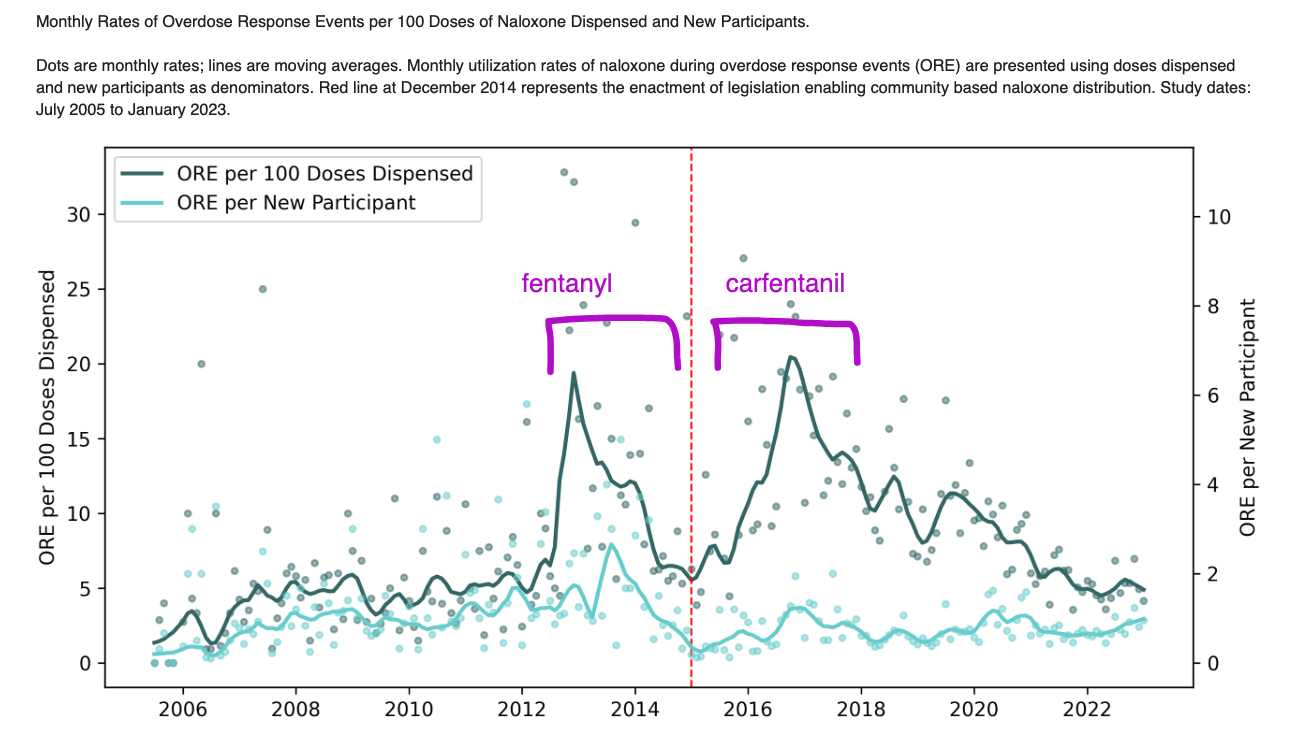
So at Prevention Point Pittsburgh, you can see that 2013-15 were high naloxone utilization years marking when illicitly manufactured fentanyl first emerged to replace heroin. And 2016-17 was when carfentanil made it's appearance.
This also provides a granular look at how long it takes for participants to adjust to newly emerging drugs, though there is so much else going on that is unobserved (e.g., fluctuations in concentration) that it would be unwise to extrapolate broadly. However, we do get an empirical benchmark of how long (about 2 years) it would be expected for OD rates to drop after the initial full-bore emergence of fentanyl, a fundamental question in explaining the east-to-west pattern of overdose death declines nationally.
Back to using this metric for data intelligence. The official Allegheny County rates for opioid-related hospital emergency admissions looks very similar to the Prevention Point reversals data! (the red dotted line above is the left axis of the graph below).
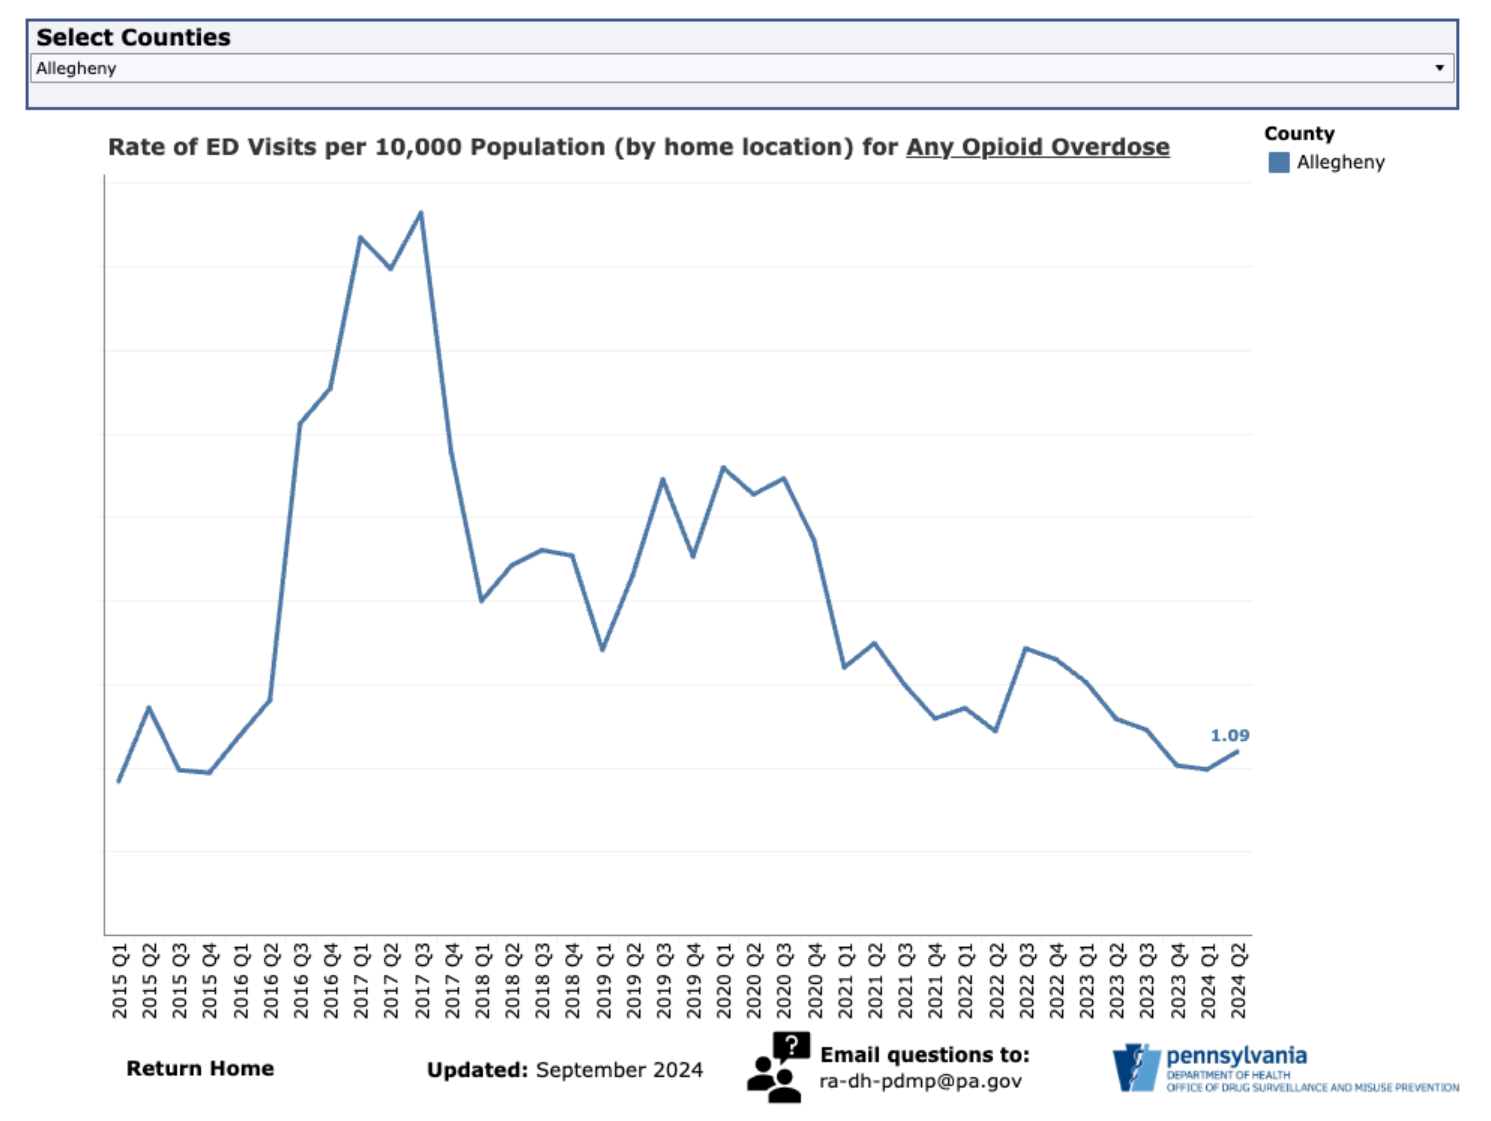
The PPPGH data are monthly, and the ED data are quarterly, but you can see a strikingly similar pattern. Programs that can look at their data monthly can stay ahead of health authority data that takes months (or years) to go public.
Again, we acknowledge that record keeping of OREs has been contentious among harm reduction programs because it can place substantial administrative burden on staff that detracts from their ability to distribute naloxone and provide other direct services. We hope the EMI framework will be a way to do this better.